The Importance of Real-Time Reporting in Contact Centers
2Ring Dashboards & Wallboards Blog Dashboards Realtime Reporting Wallboards
“If you can’t measure it, you can’t improve it,” Peter Drucker (the author of The Effective Executive, a leadership book bestseller), is often quoted. This statement is true on multiple business levels, and certainly also applicable in a mission critical, fast-paced and dynamic contact center environment.
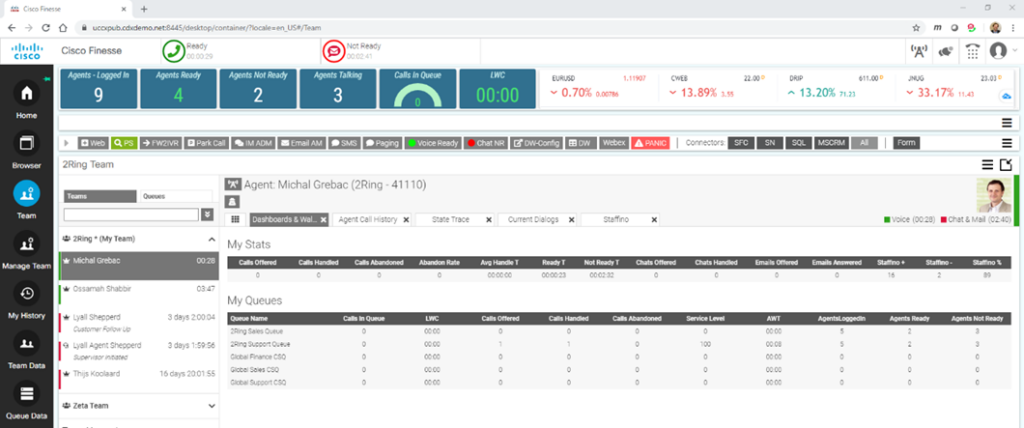
2Ring Dashboards & Wallboards offers an in-depth view of the current status (and to some degree historic insights) of the contact center. With well over 250 supported KPIs (Key Performance Indicators), a multitude of grids and an abundance of external data, 2Ring provides that type of a tool that, in our eyes and of professionals in the market, is absolutely essential for every contact center.
To uncover the actual benefits of using real-time reporting, let’s dig in a little bit deeper:
Contact Center Dashboards: The Benefits
- Receive alerts about spikes in demand (too many calls / chats / emails waiting in one of the queues) while agents only assigned to other queues are underutilized.
- Quickly detect service inefficiencies (e.g. agents are spending too much time in ready, wrap-up, or some of the NotReady states).
- Work with actionable data that helps you identify and address issues right then and there (preventing an occurrence of a snow-ball effect).
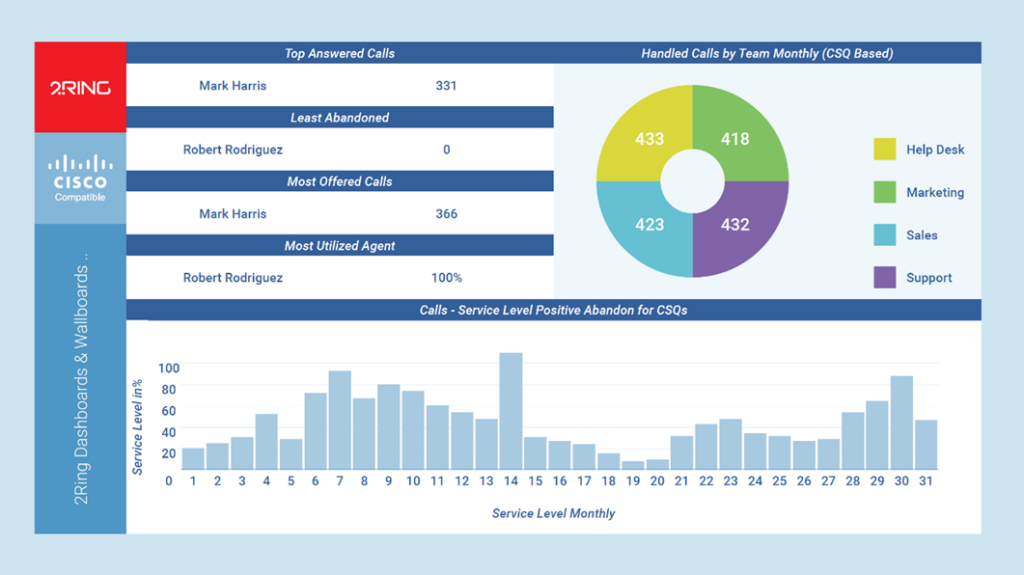
- Surround yourself with happier & more engaged workforce – use colorful charts to list top agents in metrics that make your agents and your brand unique, or show agents how they are doing on meeting their team goal (e.g. SL over 90%) per every day in the last X days, weeks, months.
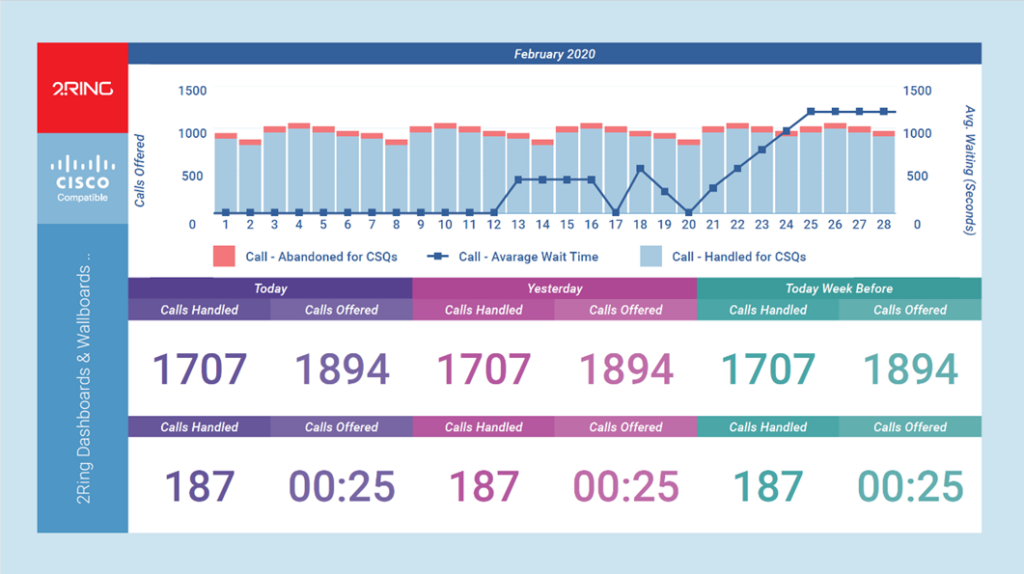
- Have the option to compare performance of agents / teams over previous periods (e.g. calls handled vs. calls abandoned) against metrics from yesterday, or from the same day last week.
- Easily share the work that the contact center does with your internal customers. For example, provide your CEO with intuitive, and visual format that offers a bird’s eye view of all the critical data, allowing users to absorb, analyze, and share vital call center insights with ease.
The items mentioned above improve overall productivity and thus inevitably enhances customer-facing interactions – giving agents chance to spend more time with customers if call volume is low and handle those conversations as efficiently as possible when the call volume is high.
Plus, contact centers that use 2Ring Dashboards & Wallboards solution can also reap additional benefits, just to name a few:
- Keeping all vital information on one screen rather than having to switch through multiple screens – layouts can run in sequences (rotation – see an example at 2Ring.com/TryIt), include data from multiple data sources (contact center metrics next to CRM or ERP data, or ServiceDesk data), provide information via various content types (pictures, PowerPoint slides, ..)
- Adjusting and updating wallboard layouts with ease and right there on the floor by business users – no need to wait for a ticket to be assigned to an IT resource
- Supporting division of layouts into business units, so every team would only get to view and update its own layouts only
The benefits listed above make it clear that a contact center should not be managed without presence of a wallboard or at least without supervisors having access to multiple dashboards showing real-time data. To support this claim, let’s also review a use case from the field – providing details on how 2Ring helped a contact center’s staff gain visibility to many actionable metrics.
Contact Center Wallboard: A Case Study
A customer was facing difficulties to keep the abandoned calls in check during peak traffic hours. The 2Ring team suggested use of a line chart that would include the Average Wait Time (AWT), Abandoned Calls & Average Talk Time (ATT) over a daily range. This helped the client gain visibility that during peak traffic hours AWT increased because of the extra inflow of calls while ATT remained approximately the same and the number of abandoned calls rose because of the corresponding increase in AWT.
For this particular client, superior customer care is one of their main objectives, so reducing AHT during these peak hours was not really a viable option as it would likely lead to a decrease in resolution rates and overall customer satisfaction.
Instead they had a look at the ‘Agents Not Ready’ rate during these peak hours, and even though it was on par with any other hour during the day, it did ultimately have a bigger impact given the increase in calls.
So instead of cutting AHT, they instructed their agents that during these peak hours they should closely monitor Calls in Queue and go “easy” on their breaks. Additionally, 2Ring configured an alert to pop a notification every time an agent wanted to switch from the ‘Ready’ state to ‘Not Ready’ when the ‘Calls in Queue’ for his/her queue was over a specified maximum threshold.
Conclusion
Every contact center is different, has unique needs, and uses different tools. If you are interested to see what kind of positive impact 2Ring Dashboards & Wallboards can have on your Contact Center, or if you are struggling to get a grip on which exact KPIs to focus on, let our team help you. If you prefer to look at our solution on your own, request access to our public demo here (all you will need is a browser and access to the Internet) or have a chat with one of our product experts by scheduling a Webex session here.