Increase Customer & Agent Engagement: The Importance of Real Time Data within the Contact Centre
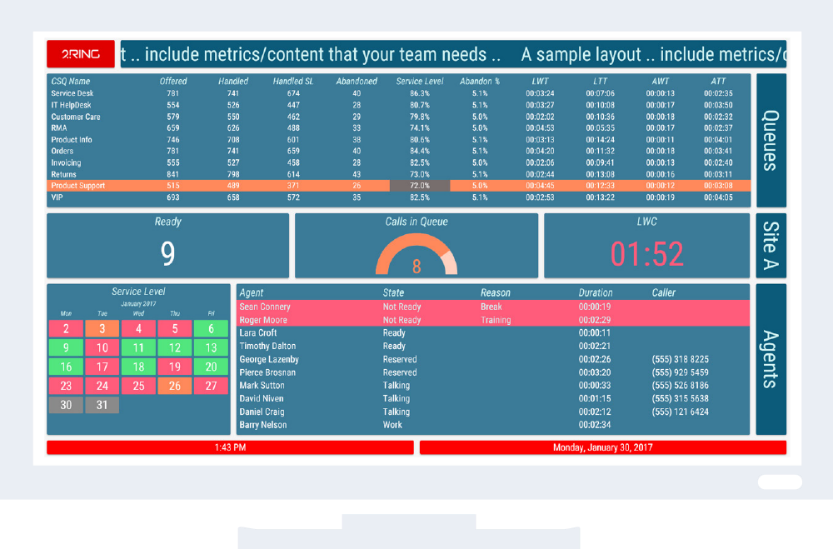
2Ring Dashboards & Wallboards Dashboards Realtime Reporting Wallboards
As both the Business to Consumer & Business to Business marketplace evolve all customers are looking for a quick, efficient & improved service. The ability to monitor and react to the performance of the customer contact center is vital for organizations to meet the service expectations of potential new customers & existing customers alike.
2Ring Dashboard & Wallboards (DW) solutions offer organizations an accurate & flexible solution to allow the contact center to align with your business priorities in real time and offer the best possible experience to your customers.
With 2Ring DW you can select over 250 KPI’s to monitor allowing you to manage resource allocation in line with the demand on your contact centre. This leads to a number of benefits, on top of enhancing your customers experience.
By setting & measuring realistic KPI’s your Contact center staff have a live visual display of the team performance and of their own personal performance if desired. We see this boosting morale of the employees and drives engagement with business goals. It also gives contact center managers the ability to react to the data shown, by re-assigning agents to busy queues for example, which leads to enhancements in productivity by having the right resource, in the right place, at the right time. The relevant people can be notified if any KPI’s exceed thresholds by visual, audible or email alerts. Happy staff, who are available when required, leads to a great service for customers.
It’s not just Call flow data that can be displayed on the DW solution, more of our client base are displaying Omnichannel KPI information for email & chat queues, sending messages in real time can be sent to the Wallboards ensuring staff are fully informed of the latest information, this can also be integrated into Cisco Finesse with the 2Ring Gadget solutions.
Measuring queues is one important metric to analyze when thinking about customer service. However, businesses these days are looking to display, in real time, what impact that the contact center is having on the business itself.
Having a busy inbound queue responding to a marketing campaign and not having an increased number of opportunities in your CRM means that something’s not right & needs to be changed immediately, whilst the demand is great. 2Ring gives you the ability to display external information from CRM & ITSM applications on your Wallboards so you can measure the effectiveness of the call center from an end to end perspective & not focus on just handling interactions quickly. With flexible working & the office anywhere ethos, we don’t just display our DW solution on large screens within the contact center. We have the ability to display on PC screens, smart TV’s, tablets & smartphones allowing remote workers and managers to view live important data wherever they are.
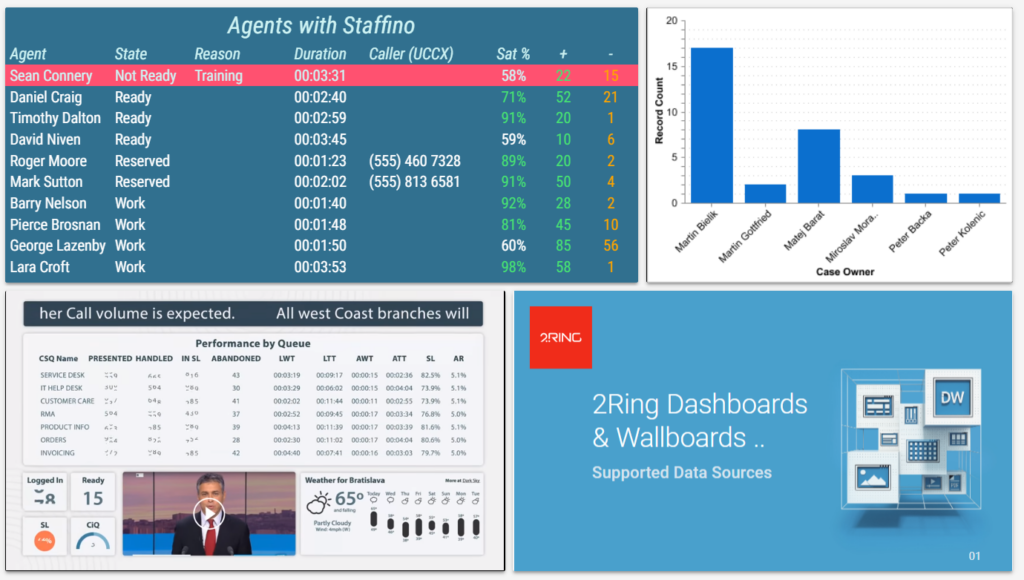
2Ring allows you to build an unlimited number of views to be displayed on an unlimited number of devices. We’re increasingly working with our end users to utilize our technology in reception areas showing the latest corporate external messaging & in breakout rooms highlighting pertinent messaging for employees via the latest presentations or videos. We even have organizations showing the weather forecast on the wallboards enabling them to make decisions on where goods will leave their distribution centersensuring deliveries don’t get held up by severe weather.
As mentioned earlier businesses & market places are evolving, at 2Ring we’ve ensured that our DW solution has, and will continue to evolve with you. Allowing you to run your business in the most efficient & effective way possible.
To see the power of the 2Ring DW solution and discuss how we can integrate real-time data to have positive impact on your business schedule a demo with your local 2Ring consultant here.
Kevin Schleising: kevin.schleising@2ring.com; Tel: +44 7842 553492