2Ring Dashboards & Wallboards v9.0
2Ring Dashboards & Wallboards Amazon Connect Cisco Five9 Genesys Cloud New Release PCCE Press Release Release Notes UCCE UCCX WxCC WxCC Enterprise

Sacramento, CA – 2Ring Dashboards & Wallboards (DW) v9.0 is available as of today. This is a major version release that brings features that 2Ring customers have been craving for a long time. Here are the highlights:
- Real time interactive sorting and filtering in grids,
- Live layout preview when hovering over layout names in the layout list,
- Simple drilldowns via support for linking of segments to different layouts,
- Personalized layouts that serve statistics relevant for the current user (create and manage one layout that is filtered dynamically for the logged-in user),
- Sliding interval periods in timeline charts,
- Total rows in grids supported with all connectors with multitude of new aggregation functions,
- Use of CSV files to add/upload custom text and data to grids (e.g., import and display personal targets and cross check those with current values),
- Enhanced themes that change layout’s entire look and feel in the instant,
- Non-admin users can now be assigned to multiple business units for viewing layouts,
- and much more.
Michal Grebac, one of our demo specialists, says, “All these new features really shine during live demonstrations. I personally think that this new release makes 2Ring Dashboards & Wallboards the best wallboard on the market and it is not even close. The flexibility and user-friendliness that it come with is something that you need to see live.” To see the 9.0 release in action, request a demo session (usually no longer than 30 minutes) here.
What’s New in DW 9.0?
- The Layout editor is a powerful tool for building and adjusting layouts’ settings. However, a pain point has been the inability to ad-hoc sort or filter data on a live layout without permanently updating it in the editor. This limitation made it challenging for supervisors to quickly sort by columns or locate specific agents within extensive lists. To address this, we are introducing real-time interactive sorting and filtering in the grids of displayed layouts. Now, adjusting sorting or applying filters takes just a matter of seconds, providing users with a more efficient and user-friendly experience. Not to mention that applied filters retain between sessions (for the current user) until cleared – see these new options in this short video.
- Release 9.0 comes with native support for crosslinking segments to different layouts enabling drilldowns. This enables for the creation of 10,000 feet overview layouts – e.g., showing the number of agents in each state per queue or team, and if needed, a single click can take your user to a layout with a detailed list of all agents currently in that given state. Of course, users can use the back icon/button in their favorite browser to return to the 10,000 feet overview since we know that is what users always go for first anyway. Watch a brief demo here.
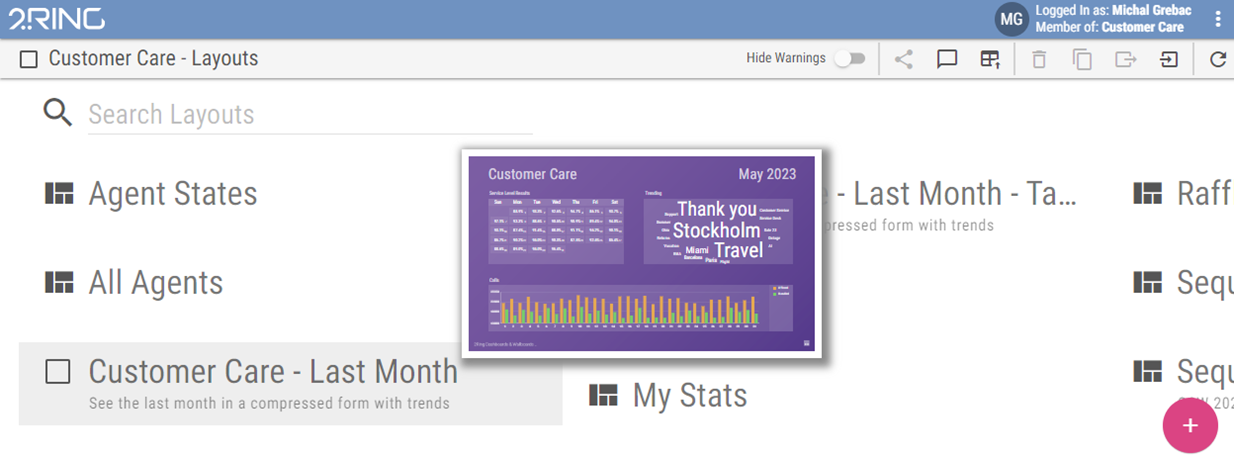
- Hover your cursor over the layout’s name to see a Live Layout Preview with current and continuously updating values – these previews appear instantly and simplify choice of the layout to view / display or to have a quick peek at current state without having to fully open a layout.
- Contact Center supervisors have always dreamed about amending our grid data with basic information – e.g., show a target for agent, team, queue, or add a column to a list of agents showing brief note next to agent’s name. To make this happen, supervisors (BU admins) are now able to upload custom tables from CSV files for use in their BU layouts. Of course, this data is not only displayed, but it can be used in calculations as well. If you set a target, the updated target value is then going to be used in related calculations. These data imports are incredibly simple and straightforward. All you need to do is download the file, open it in a spreadsheet application, make your desired updates, save the changes, and finally, upload the file back. It is a hassle-free process that ensures seamless data management. Watch an update of personal targets for agents here.
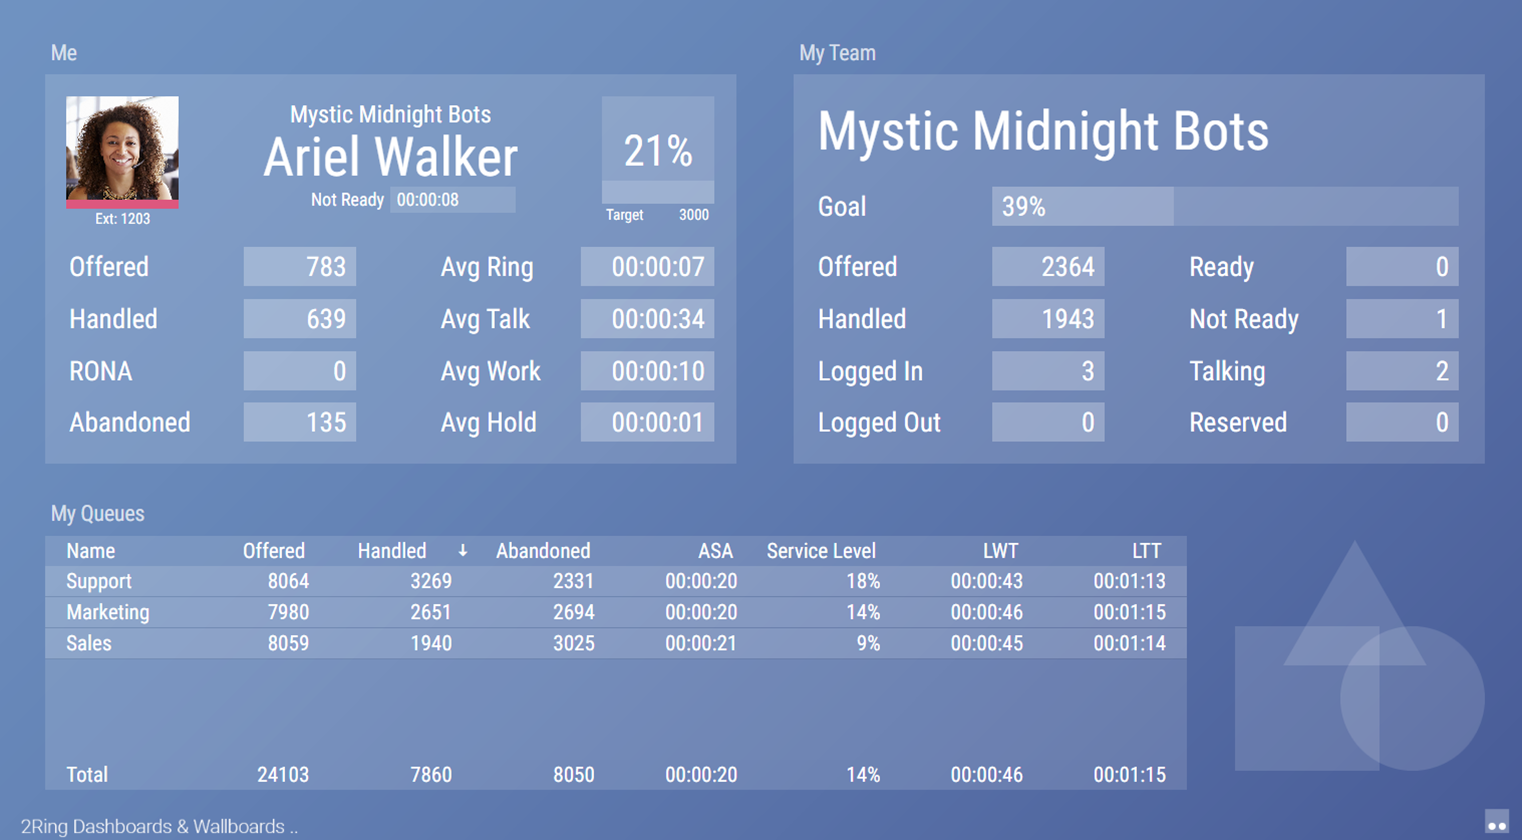
- Creating personalized layouts has been simplified through the utilization of enhanced user attributes that have been restructured to incorporate grid calculation data. In other words, design a layout where each user can access the same link but view only their respective data. Here is a short video showing the same layout accessed by two different users and an administrator who doesn’t have any contact center data. Watch a short overview video here.
- Timeline Charts now also support sliding intervals as one of the options for the period selection (e.g., last 8 hours, 3 weeks, or 2 months). For example, you can now maximize space utilization by displaying only the most recent 7 days of data, eliminating the need to allocate valuable space for a two-week period (including this week and last week). The same is possible for any of the interval types (15min, 30min, Hour, Day, Week, Month, Year).
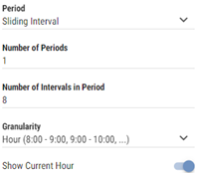
Sliding Intervals – Settings
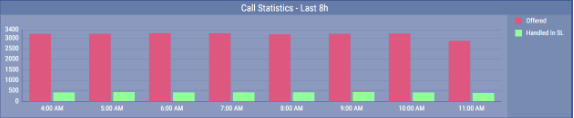
Sliding Intervals – Timeline Chart
- With the goal of improving the ease of managing and editing layouts, release 9.0 introduces multiple usability improvements for layout creators:
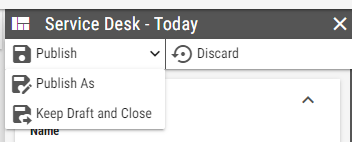
- In previous versions, if you started making modifications to your layout without creating a prior copy and could not complete the changes in time, you faced a dilemma. You either had to discard all your progress or publish your unfinished work, pushing it to your users. Now, you have two options to resolve this situation:
- Save layout draft – Layouts can be saved without publishing. Work can be resumed later.
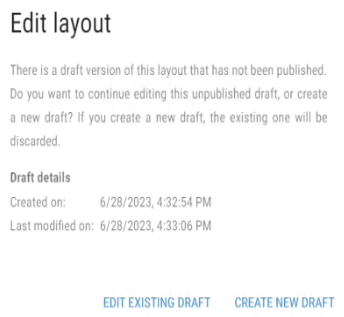
- Publish As – Layout can be published to a new copy in its current state without changing the original.
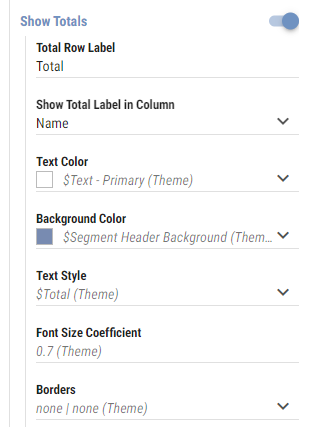
- Adding (or removing) a “total row” to your grid is now as easy as toggling a radio button:
- Now, you can manage images directly in the main layout list of the Business Units. Previously, this functionality was only accessible within the layout editor interface when adding an image to the layout.
- New segment types to accommodate even the boldest visions and vector graphic designs that include rectangle, ellipse, or triangle shapes.
- Font styles, border styles, and line styles can now be copied to the clipboard and be pasted in other segments or layouts.
- When configuring conditional styles, it is now possible to add test values for KPIs and Pie Chart Segments. This allows for the style rules to be assessed without having to wait for live data from the connector to meet the configured condition.
- Custom CSS properties can now be defined for text elements.
- The KPI Calendar segment has been enhanced to utilize the same data presentation capabilities as KPIs for the represented days. This means that it now includes all the visual styling features of KPIs, such as presentation types and conditional styles.
- The 9.0 release comes with enhancements for administrators as well:
- Audit logging added – login events and all security related changes to the system are now recorded.
- Segment default settings, formerly known as Inheritable Settings, have now been moved into Themes. Themes allow users to easily change the entire look and feel of each layout. On top of that, it is now possible to create multiple themes for each business unit, export/import themes as needed, and to modify or create themes directly from the layout editor.
- When copying a layout from one business unit (BU) to another, including a “shared BU,” parameter groups will now be carried over as well. This eliminates the need to manually recreate these groupings in the admin tool for each BU where the layout with parameter groups is copied.
- Now you can specify a Support Contact Point that will be displayed if an error occurs, providing users with the necessary information on who to contact for assistance. Additionally, error messages have been enhanced to be user-friendly and will not overwrite your content or values in the event of issues such as obsolete data, connector failures, outages, and more.
- 9.0 also brings the option for a non-admin user to have access (view only) to multiple assigned BUs. We are sure that this is going to make life easier for a lot of users out there.
Upgrades
Existing 2Ring Customers should take a note that the 2Ring Dashboards & Wallboards 9.0 release does not currently support upgrades from earlier versions. However, we have good news! Automated upgrades will be introduced in the upcoming 9.1 release, which is expected to be available by the end of July or early August. We strongly encourage all our customers to take advantage of the 9.1 release and upgrade their 2Ring Dashboards & Wallboards as soon as it becomes available, to secure your spot in the queue, please request upgrade by opening a support ticket here.
End of Life Notice for Older Dashboards & Wallboards Versions
Please be advised that End of Life notices have been posted for older versions of 2Ring Dashboards & Wallboards (v8.4x – 8.8x). The full press release can be accessed here.
Have You Missed Previous Product Updates?
- Cisco Finesse Connector – a brand new connector for customers with UCCX/UCCE/PCCE and Webex Contact Center Enterprise. Adding this connector enables almost instant updates to agent state (incl. time in state, reason code, pending states, and more).
- 8.8 (incl. 8.7) Release Notes – a new user role (message author), a native SQL Connector enabling connections to 3rd party SQL data sources, lighter license enforcement rules, and more.
- 8.6 Release Notes – added talking heads (agent detail widgets), floor plans, unlimited number of thresholds (flexible value ranges), present values as images, personalized layouts – presenting different data to different users, and other usability enhancements.
- 8.5 Release Notes – added word cloud, a new messaging tool (incl. support for displaying temporary announcements/messages), multiline banners/tickers, new color picker, font settings, total rows, alternating row styles, and column presets.
What’s Next?
There is a lot to look forward to, so stay tuned by connecting with us and signing up to our RSS channel, or by following us on social media – LinkedIn, X, and Instagram.